If you’ve just unboxed your TI-84 Plus CE and feel a little overwhelmed by the sea of buttons, you’re not alone. This calculator is the gold standard in high school and college math classrooms—and it’s the #1 test-day companion for the SAT and ACT. But here’s the secret: once you learn a handful of real-world workflows (not just the button names), the TI-84 becomes an extension of your brain.
In this guide, you won’t just read about features. You’ll follow exact button sequences, solve SAT-style problems, master the statistics tools teachers never explain, and sidestep the beginner mistakes that trip up most students. We’ll focus especially on the TI-84 Plus CE, but nearly everything applies to the TI-84 Plus and TI-84 Plus C Silver Edition as well.
Let’s turn you into a confident calculator user.
Meet Your TI-84 Plus CE: Power, Modes, and the Home Screen
Before jumping into graphs, you need to make friends with the calculator’s layout and settings. Many errors start right here.
Turning on and off
- Press [ON] (bottom left) to power up.
- To turn off, press [2nd] then [ON] (you’ll see OFF above the ON key).
When you power on, you see the home screen—a blank space where you can type math expressions and run commands. Think of it as your main command center.
Adjusting the mode settings
Your calculator needs to match your math problem. Press [MODE] to open the mode menu:
- Normal, Sci, Eng: keep on Normal.
- Float (decimal display): Float means the calculator decides how many decimals to show; Float 0–9 lets you fix decimal places. For most work, use Float.
- Radian/Degree: This is critical for trigonometry. SAT problems almost always use degrees. A quick check: if you type sin(30) and press enter, it should show 0.5 in degree mode. If you see something weird like -0.988, switch to degree.
- Function, Parametric, Polar, Seq: choose Function unless you’re working with parametric or polar equations.
Clearing the home screen and memory
- To clear the home screen, press [CLEAR].
- To delete a line you typed, use [CLEAR] while the cursor is on that line.
- If things get really messy, reset the RAM (this does not delete apps): press [2nd] [MEM] (the + key), select 7:Reset, then 1:All RAM, then 2:Reset. This erases variables, lists, and settings but leaves your calculator functional. Use it when your calculator starts acting unpredictably.
Now that the home screen is understood, let’s tackle the #1 mental model that beginners miss.
The Two Worlds: Home Screen vs. App Menus (Why This Matters)
The TI-84 has two distinct “spaces,” and not knowing this causes frustration.
Home Screen
Where you perform quick calculations, evaluate expressions, and run commands from any menu. You’re on the home screen when you first turn on the calculator.
App Menus and Built-in Tools
These are dedicated screens you enter to do a specific job:
- [Y=] opens the equation editor for graphing.
- [STAT] opens the statistics list editor and calculations.
- [APPS] opens installed applications (like Inequality Graphing, Transformation, etc.).
- [MATH] opens a menu of math functions (numerical derivative, solver, fractions).
- [PRGM] opens program editor.
How to leave an app and return to the home screen
Press [2nd] [QUIT] (the MODE key). It’s the universal escape hatch. Memorize it now.
Example of confusion: a student opens the Y= editor, types equations, then wants to evaluate 3+4. They start pressing keys and get a SYNTAX error because they’re still inside the graph editor, not on the home screen. Teach your fingers: do your graph work, then [2nd] [QUIT].
Pro tip: If your screen looks unfamiliar or shows table columns/graphs, try [2nd] [QUIT] first. It fixes 90% of “why can’t I just type?” moments.
How to Graph Equations and Find Intersections, Zeros, and More
Graphing is where the TI-84 shines, and it’s the skill most tested on the SAT and ACT. We’ll walk through the entire pipeline with actual button presses.
Step-by-Step: Enter and Graph a Single Line
- Enter the equation
Press [Y=]. You’ll see Y1, Y2, … Y0. Type 2X+3 next to Y1.
Use the [X,T,θ,n] key for X. Use the [(-)] key (next to ENTER) for a negative sign—not the minus key.
Your screen: \Y1=2X+3 - Set a friendly window
Press [WINDOW]. For a quick standard view, set:- Xmin=-10, Xmax=10, Xscl=1
- Ymin=-10, Ymax=10, Yscl=1
You can also press [ZOOM] and select 6:ZStandard to auto-set these values.
- Graph it
Press [GRAPH]. You’ll see a straight line crossing the axes.
Graphing Two Lines and Finding Their Intersection (SAT MVP)
Being able to solve a system of equations by graphing is a massive time-saver. Let’s solve:
y = 2x – 5 and y = –x + 4
- Press [Y=].
Clear any old equations by highlighting the = sign and pressing [CLEAR].
Enter 2X-5 for Y1.
Enter -X+4 for Y2. Use the [(-)] key for the negative. - Graph: press [GRAPH]. You’ll see two lines.
- If you can’t see the intersection, adjust the window or use [ZOOM] 0:ZoomFit after making sure both Y’s are displayed.
- Find the intersection
Press [2nd] [CALC] (above TRACE).
Select 5:intersect.- The cursor jumps to the first curve. Press [ENTER].
- Jumps to second curve. Press [ENTER].
- Now it asks “Guess?”. Move the blinking cursor close to the intersection using the left/right arrow keys, then press [ENTER].
The screen shows Intersection X=3 Y=1. So the solution is (3,1).
Finding Zeros (X-Intercepts) of a Single Equation
Example: Find the roots of y = x² – 4. Graph it, then:
- Press [2nd] [CALC], choose 2:zero.
- It asks for left bound: move cursor to the left of one x-intercept, press [ENTER].
- Right bound: move to the right, press [ENTER].
- Guess: position cursor near the intercept, press [ENTER]. The calculator displays Zero X=-2 Y=0. Repeat for the other side.
Top Beginner Graph Mistakes and Fixes
| Problem | What’s Really Happening | Fix |
| Graph won’t show anything | The equation sign is not highlighted (turned off) | In Y=, move to the = and press [ENTER] to toggle it back on |
| Screen is filled with weird scatter plots or lines | Stat plots are interfering | Press [Y=], arrow up to highlight Plot1, Plot2, or Plot3 at top of screen, press [ENTER] to deselect (no black background) |
| “ERR: SYNTAX” when typing equation | You might have used the minus sign for negative number | Always use [(-)] for negatives inside equations |
| “ERR: WINDOW RANGE” | Window settings are logically impossible | Press [ZOOM] 6:ZStandard to reset |
| Only part of the graph is visible | Window is too zoomed in/out | Manually adjust Xmin/Xmax and Ymin/Ymax, or use [ZOOM] 0:ZoomFit |
Once you’ve mastered graphing, you have a superpower for multiple-choice math. Next, we’ll conquer the tool most SAT prep books gloss over: statistics.
Statistics 101: Entering Data, 1-Var Stats, and Linear Regression
Many students avoid the statistics tools because the button path feels foreign. But these tools are gold on the SAT’s Data Analysis problems and in any algebra or science class.
Entering Data into Lists
- Press [STAT] and select 1:Edit…. You’ll see lists L1, L2, L3, etc.
- Type data values into L1, pressing [ENTER] after each. For example, SAT math practice scores: 450, 520, 600, 680, 720. Enter those five numbers down L1.
- To clear a list, highlight the list name (e.g., L1 at the top), press [CLEAR], then [ENTER]. Do not press [DEL]; that just deletes one cell.
Running One-Variable Statistics (Mean, Median, Standard Deviation)
- Press [STAT], then right arrow to the CALC menu.
- Choose 1:1-Var Stats. The screen shows 1-Var Stats with a blinking cursor.
- Press [2nd] [1] for L1 (the calculator pastes L1). If you don’t specify a frequency list, each entry counts once; just press [ENTER].
- A list of output appears. Important values:
- x̄ (x-bar) = mean
- ∑x = sum of all values
- Sx = sample standard deviation (use this for a sample)
- σx = population standard deviation
- n = number of data points
- Scroll down for the five-number summary: min, Q1, Med, Q3, max.
SAT example: determine the median of a dataset quickly by reading the Med= value.
Linear Regression and Correlation Coefficient
This is huge for advanced algebra and SAT “line of best fit” problems.
- Enter x-values in L1 and corresponding y-values in L2. Make sure lists are equal in length.
- If you want the correlation coefficient r displayed, you must turn on diagnostics. Press [2nd] [CATALOG] (the 0 key), scroll to DiagnosticOn, press [ENTER] twice. It should say “Done”.
- Press [STAT], right arrow to CALC, select 4:LinReg(ax+b) (or 8:LinReg(a+bx) depending on OS; both work).
- To auto-insert L1 and L2, after the command appears, press [2nd] [1] [,] [2nd] [2]. The screen shows: LinReg(ax+b) L1,L2.
- Press [ENTER].
You’ll see:- a = slope
- b = y-intercept
- r² and r (correlation coefficient). The closer r is to 1 or –1, the stronger the linear relationship.
Common Statistics Errors
- “ERR: DIM MISMATCH”: Your lists aren’t the same size. Check for blank cells or missing entries. Clear both and re-enter.
- Scatter plot not showing: Active stat plot? Press [2nd] [STAT PLOT], choose Plot1, turn it On, select scatter plot, Xlist L1, Ylist L2, then graph with [ZOOM] 9:ZoomStat.
- Accidentally overwriting list data: Always back up important lists before starting new work.
Now let’s shift to your algebra toolbelt—methods you’ll use daily.
Algebra Power Moves: Solver, Tables, and Storing Values
Graphing isn’t always the fastest route. For quick equation solving and function evaluation, use these three built-in heroes.
Using the Equation Solver
The solver finds solutions to equations set equal to zero. Suppose you need 2x² – 8 = 0.
- Press [MATH], scroll to B:Solver… (its number may be 0 on newer OS), press [ENTER].
- If an old equation appears, press the up arrow to edit.
- Set equation equal to zero: type 2X^2-8 in the line EQUATION SOLVER eqn:0=.
- Press [ENTER], then cursor to the X= line. Enter a guess (e.g., 1). Press [ALPHA] [SOLVE] (above ENTER). It will compute and show X=2. To find the other root, change the guess to something like –1 and solve again.
Solver works even when equations get messy, like X^3 – 2X = 5. Just rewrite as X^3 – 2X – 5 = 0.
Evaluating Expressions with Stored Variables
Use this to check your work on homework or SAT grid-in questions.
- Assign a value to X: type 5, then press [STO>] (above ON), then [X,T,θ,n], then [ENTER]. Now X=5.
- Type an expression like 2X+3 and press [ENTER]. The calculator returns 13.
- To change X, just store a new value the same way. This is much faster than retyping a huge expression.
Using the Table for Multiple Function Values
Perfect for seeing patterns or checking “which x makes f(x)=…?” questions.
- Enter one or more functions in Y=.
- Set table parameters: press [2nd] [TBLSET] (above WINDOW).
TblStart = starting x-value, ∆Tbl = step. For example, TblStart=0, ∆Tbl=1. - Press [2nd] [TABLE] (above GRAPH). You’ll see columns of corresponding Y1 values.
- Scroll through to spot where Y1 becomes zero, or where Y1 matches Y2.
| Problem Type | Best TI-84 Tool | Why |
| Solving a single equation | Solver ([MATH] B:Solver) | Direct numerical answers |
| System of equations | Graph + intersect | Visual, fast, SAT favorite |
| Evaluate a function repeatedly | Table | Spot patterns, answer multiple-choice |
| “For what x is f(x)=5?” | Graph + intersect with Y2=5, or Table | Dual approach |
| Statistics analysis | Lists + 1-Var Stats / LinReg | Exact descriptive stats |
SAT & ACT Math Strategies Using Your TI-84
Test day is where the TI-84 becomes a legitimate advantage. Every second matters, and the calculator can solve problems in under 30 seconds that would take 2 minutes by hand. Below are three real SAT-style scenarios and the button-by-button path to the answer.
SAT Scenario 1: Find the solution to the system
*y = –0.5x + 3* and *y = 2x – 1*
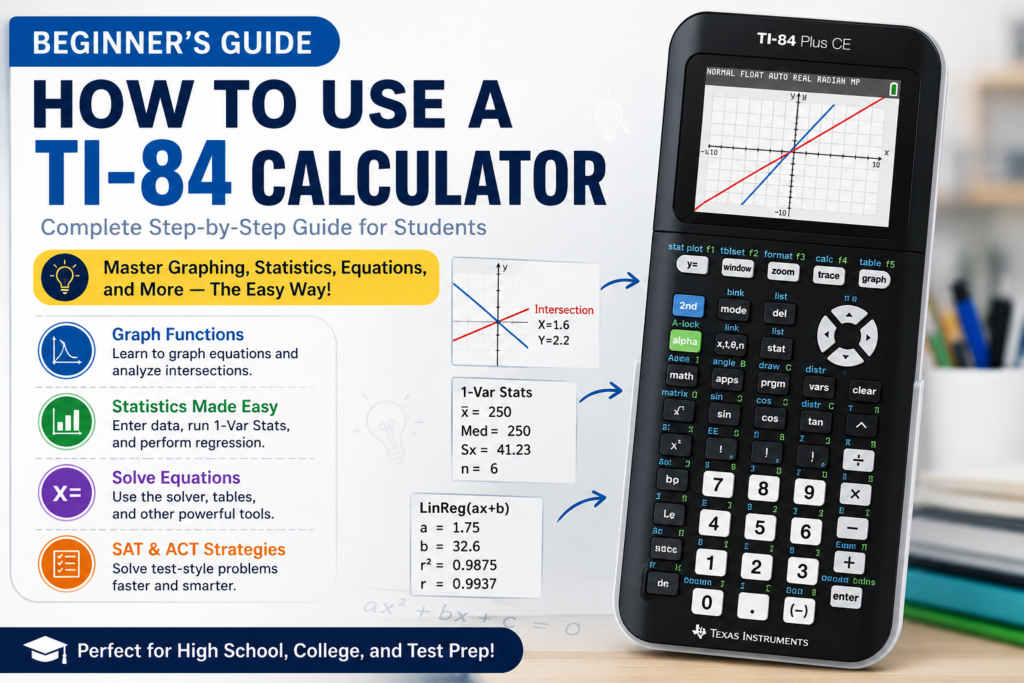
- Enter both in Y=, graph, use intersect (see the earlier walkthrough). Answer: (1.6, 2.2).
SAT Scenario 2: Mean and median of a data set
Data: 210, 240, 190, 260, 310, 290 (Math score sample). Enter L1 → run 1-Var Stats. Mean = 250, Median = 250.
SAT Scenario 3: Minimum value of a quadratic
*Find the minimum of f(x) = 3x² – 12x + 7*
- Graph the equation. Press [2nd] [CALC] 3:minimum. Set left bound, right bound, guess near the vertex. The calculator displays the minimum at (2, -5). It’s a one-minute process.
Pro-tip for test day: Always verify your Mode is Degrees for geometry/trig questions. Radians will silently give you wrong angle values.
Troubleshooting: Top 10 Beginner Mistakes and Fixes
You’ll inevitably run into an error. Here’s how to recover without panic.
- ERR: SYNTAX
Cause: Misplaced parenthesis, using minus instead of negative, or running a command in the wrong screen (like typing inside Y=).
Fix: Press [2nd] [QUIT] to exit. Check your expression, use [(-)] for negatives. - ERR: DIM MISMATCH
Cause: Unequal list lengths in statistics or regression.
Fix: Clear all used lists and re-enter the data so each list has the same count. - Graph shows nothing
Cause: Equation toggled off, stat plot covering screen, bad window.
Fix: In Y=, highlight = and press ENTER to activate. Turn off stat plots. Press ZOOM 6. - Wrong trig values
Cause: Radian/Degree mismatch.
Fix: Press [MODE], switch to Degree if working in degrees. - Memory full: “ERR: MEMORY”
Cause: Too many stored programs or apps.
Fix: Press [2nd] [MEM], choose 2:Mem Mgmt/Del…, delete unwanted items. - Can’t find r and r² after regression
Cause: Diagnostics off.
Fix: Run DiagnosticOn from the catalog (as shown earlier). - Garbage characters on screen
Cause: Almost dead batteries or a software glitch.
Fix: Replace AAA batteries; the CE also has a rechargeable battery built in so try a hard reset: [2nd] [MEM] 7:Reset. - Equation solver won’t find answer
Cause: Poor initial guess, or no real solution exists.
Fix: Change the guess to a different number, or check graphically first. - Typing letters instead of X
Cause: Pressing ALPHA before needing the variable.
Fix: Use [X,T,θ,n] for the X variable without ALPHA. - Slow performance
Fix: Archive old stuff; clear RAM occasionally.
Quick Calculus Help: Derivatives and Integrals
Calculus students often don’t realize the TI-84 can check their hand work. Use numeric derivative (nDeriv) and numeric integral (fnInt). Both live in the [MATH] menu.
Numeric derivative: Find the slope of f(x) = x³ at x = 2.
- Press [MATH], scroll to 8:nDeriv(.
- Syntax: nDeriv(expression, variable, value). So type: nDeriv(X^3, X, 2). Press [ENTER].
- Result: 12. Indeed derivative 3x² → 12.
Definite integral: Compute the area under *f(x) = 4x – x²* from 0 to 2.
- Press [MATH], scroll down to 9:fnInt(.
- Syntax: fnInt(expression, variable, lower, upper): fnInt(4X-X^2, X, 0, 2). Press [ENTER].
- Result: 5.333… (which is 16/3).
These are perfect for verifying homework answers and building confidence before a calculus exam.
FAQ – Your Top TI-84 Questions Answered
How do I turn off my TI-84 Plus CE?
Press [2nd], then [ON]. It will shut down completely.
How do I clear all memory?
Press [2nd] [MEM], select 7:Reset, then 1:All RAM, then 2:Reset. This erases user data but keeps Apps.
How do I put my calculator in degree mode?
Press [MODE], arrow down to Radian, highlight Degree with the arrow keys, press [ENTER]. Then [2nd] [QUIT].
Why is my calculator showing scientific notation?
The number is very large or small. You can change the display in [MODE] from Sci to Normal.
How do I update the operating system on my TI-84 Plus CE?
Download TI Connect CE software from Texas Instruments, connect your calculator via USB, and use the software to update. Always back up files first.
What’s the difference between [(-)] and the minus key?
The ** [(-)] ** key (next to ENTER) is for negation (e.g., –5). The minus key [–] is for subtraction. Using minus where negative belongs causes syntax errors.
How can I find the slope of a line quickly?
Graph the line, then use 2:zero or 6:dy/dx in the [2nd] [CALC] menu for a numeric derivative at a point, or use nDeriv from the home screen.
Why do I get “ERR: BOUND”?
In intersect or zero routines, your left bound and right bound may not bracket the feature. Adjust your bounds or zoom out.
Conclusion: Keep Practicing with Real Problems
Your TI-84 Plus CE is not just a fancy number cruncher—it’s a thinking partner. The more you practice these workflows with actual math, SAT sample questions, and statistics data, the more natural the key sequences will feel. Bookmark this guide and return to it whenever you hit a snag.
If you’re gearing up for the SAT or ACT, explore our other resources on test-day calculator strategies and the best SAT-approved calculators. Don’t just learn the buttons—learn the problems they solve.
Now go graph something cool.